8.1 箱型图 EMP_boxplot
箱形图(又称盒须图、盒式图、盒状图或箱线图),是一种用于展示数据分布情况的统计图。
注意:
①模块
②更全面的差异性分析可通过模块
①模块
EMP_boxplot主要用于差异性分析结果的快速可视化,无法实现配对检验或两组以上数据的方差分析、秩和检验。②更全面的差异性分析可通过模块
EMP_diff_analysis来实现,用户可手动修改图示的p值。8.1.1 针对丰度数据的箱型图
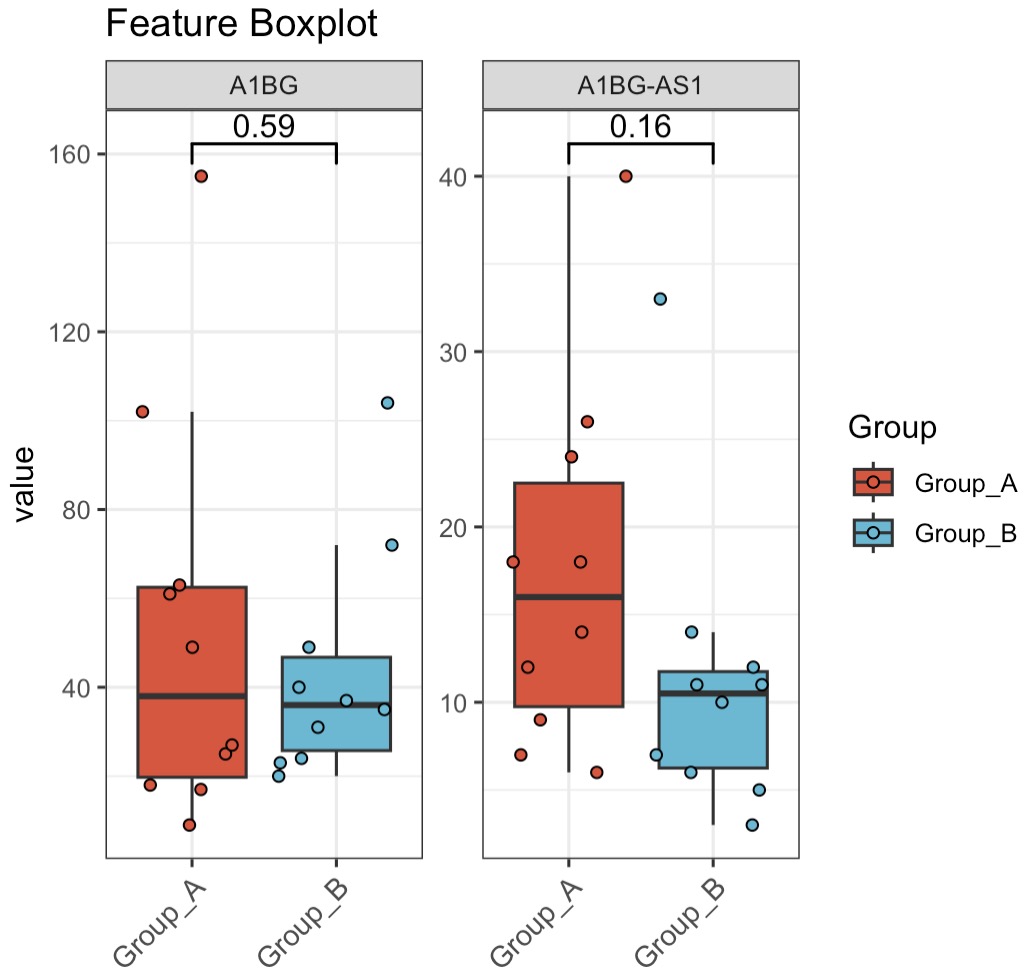
🏷️示例:
MAE |>
  EMP_assay_extract('host_gene',pattern = 'A1BG',pattern_ref = 'feature') |>
  EMP_boxplot(method='t.test',estimate_group='Group')
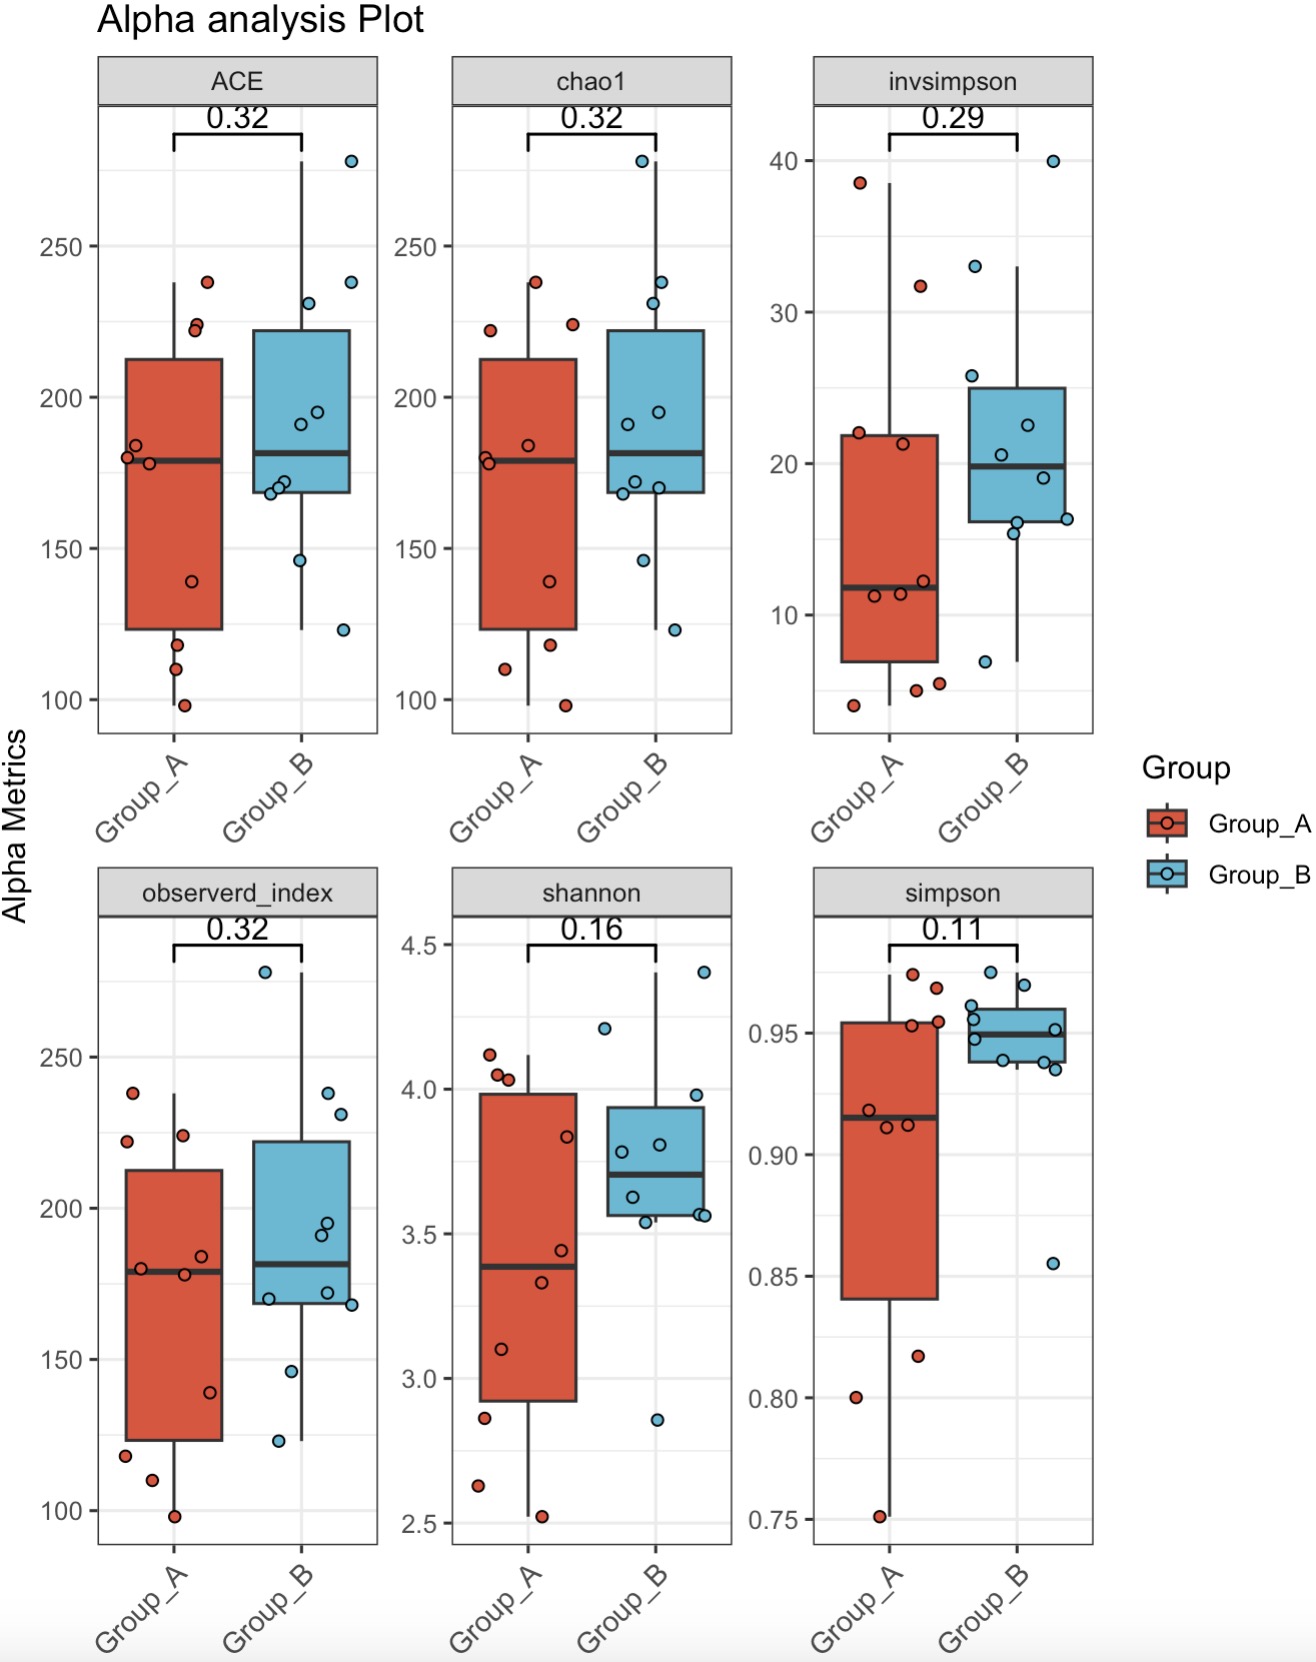
8.1.2 针对alpha多样性指数的箱型图
🏷️示例:
MAE |>
  EMP_assay_extract('taxonomy') |>
  EMP_alpha_analysis()|>
  EMP_boxplot(method='t.test',estimate_group='Group')